How to Create a Data Flow Diagram
To create a data flow diagram in SmartDraw, select the blank Data Flow Diagram (DFD) template from the Software Design category on the dashboard under New Document.
The template contains a basic starting point for your diagram and a SmartPanel customized with symbols for building it. Every SmartDraw template has set of tool palettes docked to the left of the work area call the SmartPanel. This SmartPanel contains all the tools, libraries, and shortcuts you'll need to build your data flow diagram.
To add a process step in your data flow, you can use the Quick Action Controls, the yellow dots around a selected shape. These Quick Action Control buttons let you drag your mouse to draw a connected line and then choose a shape to add from a pop-up menu of options.
This menu is intelligent and will populate with the last 6 symbols you've used in your diagram, so you'll always have the right symbols at your fingertips.
You can also hold down the [CTRL] key and hit any arrow key to automatically add the most recently used shape in the direction of the arrow.
To add text, simply type while the box is selected.
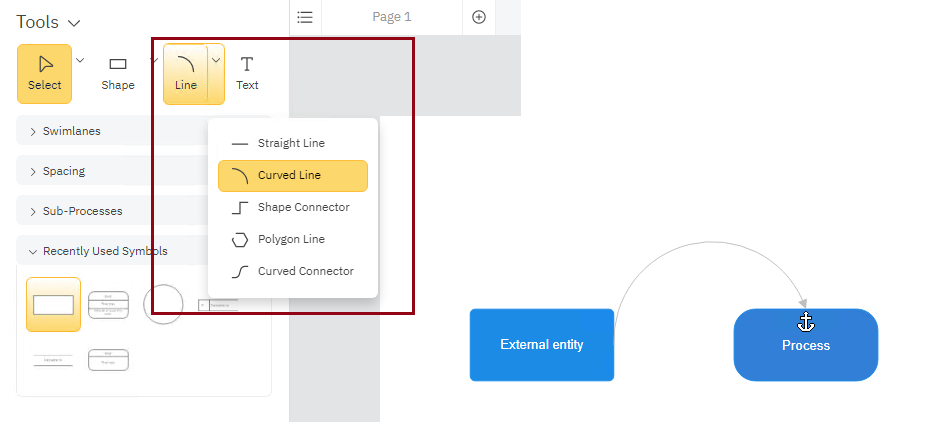
You can also connect symbols after the fact. Drag and drop all the process steps, data stores and entities you need to your page and position them where you want. You can then connect the symbols to each other using lines. Click on the Line menu at the top of the SmartPanel, to the left of your main workspace and choose either a straight or curved line.
Next, touch your cursor to the edge of one shape. You should see black connection dots appear around the shape and your cursor should look like a pencil. Now, drag your cursor towards the shape you want to connect to. Your line will be ready to connect when you see the black connection dots appear around the second shape and your cursor changes to an anchor symbol. Let go of your mouse to connect the two shapes. Repeat as necessary to connect all your shapes.
You can easily adjust the degree of curvature for any curved line using the special black adjustment handle at the center of the line. Just drag it until you're happy with the way your line looks.
If you need to share your data flow diagram with colleagues, you can easily send them a link to your visual. They won't need to own SmartDraw or even create an account to see your diagram. Click the Share button on the top right of your app.
You can also easily export your DFD and insert it into Microsoft Word®, PowerPoint®, Confluence, or any Google Workspace app easily.
Once your data flow diagram is ready, click on Export under the Home tab and choose Export to Office.
Reading raw code is hard, but visuals can help you make sense of your system or app. If you need to visualize the flow of an information system or data process, create a data flow diagram with SmartDraw.