VS.DataTable()
An instance of a VS.DataTable() is created by adding one to a VS.Document() object:
myDataTable=myDocument.AddDataTable(ID,Name,CSVString)
Both Name and ID are optional and if not supplied default unique values will be applied. The Name variable is only relevant when building a SmartDraw Extension. It is the human readable name of the table shown in the SmartDraw Shape Data UI.
A DataTable consists of a list of fields (columns)
and rows of values for each of these fields. A row of values can be assigned to a VS.Shape() object.
This is called Shape Data.
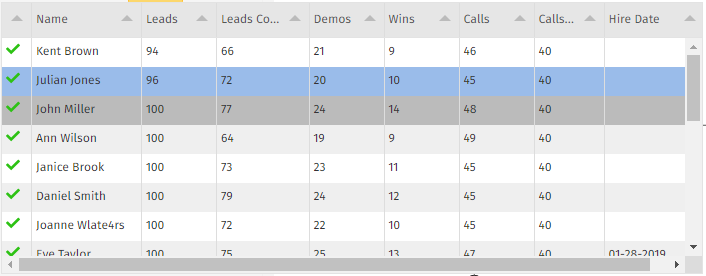
CSVString is also optional and can contain row and column data values formatted in CSV format. The first row defines columns. All columns are text fields. Columns can also be added to the table using the SetColumns() method below and row values can be added with the AddDataRow() method.
In resulting visual, a shape with Shape Data shows an information icon which displays a tooltip showing the data:
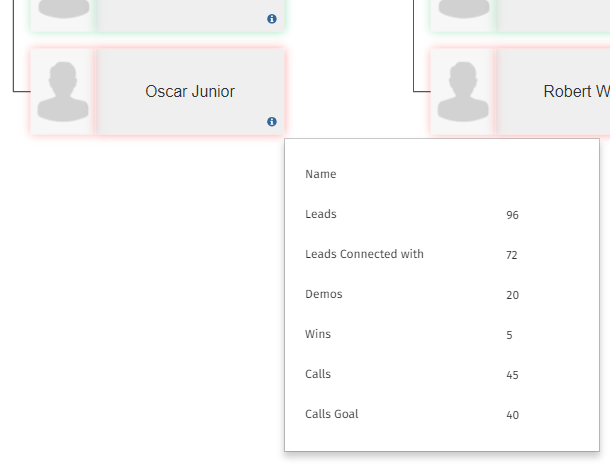
Visuals built with Shape Data can be rich with information without cluttering the design.
- AddDataRow() - Adds a VS.DataRow() object to a DataTable
- SetColumns() - Sets the name,type and default style of the columns of a DataTable.
Example
myDataRow=myDataTable.AddDataRow(1);
Syntax
myDataRow=myDataTable.AddDataRow(ID);
Usage
This method adds a VS.DataRow() object to a DataTable. The ID is optional. If omitted, the new row will be assigned a unique ID. If the ID of an existing row is passed, AddDataRow() returns the existing row and does not allocate a new one.
SetColumns()
Example
myDataTable=myDataTable.SetColumns([{Name:"Name",Type:VS.DataColumnTypes.Text},{Name:"Hire Date",Type:VS.DataColumnTypes.Date,Style:"background-color:blue"}]);
Syntax
myDataTable=myDataTable.SetColumns(columnarray); //where columnarray is an array of {Name:"",Type:"",Style:""}
Usage
This method adds columns to a DataTable. Upon creation a DataArray has no columns. SetColumns adds columns to the table. A second call to AddColumns() will add additional unique columns to the DataTable.
The columnarray passed is an array of column objects:
(Name:"myName",Type:VS.DataColumnTypes,Style:"css"}
The following types are supported:
VS.DataColumnTypes =
{
Text: "string",
Int: "int",
Float: "float",
Bool: "bool",
Date:"date", //in YYYY-MM-DD format
Header:"header",
};
In most cases using Text for a column type is sufficient.
A Header column has no value and creates a separator in the data tool tip with a label given by the field name. The styling applied when defining the columns styles the label in this case. Style specifies the default appearance of a value for the column when it displays in the data tool tip. It is optional and is a limited set of CSS. The CSS commands supported are:
['background-color', 'color', 'font-style', 'font-weight', 'text-align', 'text-decoration', 'text-shadow']
An instance of a VS.DataRow() is created in two ways:
- by adding one directly to a VS.DataTable() object
- by adding one to a VS.Shape()
The two methods support two different strategies for assigning data to shapes. The first (adding directly to the data table) works best when the data and its association with a shape is well-known up front. The second method (adding data via the shape) works best when data is known at the time that the shape is created.
Adding a DataRow() Directly to a DataTable()
myDataRow=myDataTable.AddDataRow(ID)
The VS.DataTable.AddDataRow() method adds a new data row to an existing DataTable. The ID is the unique ID of the row and is optional. If omitted, the row is automatically assigned a unique ID.
The new added row has empty values for each column in the table. Data values are added using the VS.DataRow.SetValues() method.
Adding a DataRow() to a VS.Shape()
myDataRow=myShape.AddShapeDataRow(myDocument,TableID);
The VS.Shape.AddShapeDataRow() method takes the VS.Document object, and the TableID of an already defined DataTable, adds a new empty row and assigns to the Shape. Both parameters are required.
Data values are added using the VS.DataRow.SetValues() method.
- SetValues() - Sets the values for each column of a DataRow.
Example
myDataRow=myDataRow.SetValues([{Name:"Name","Value":"James Smith",Style:"background-color:blue",Link:"www.smartdraw.com"},{Name:"Title","Value":"HR Manager"}]);
Syntax
myDataRow=myDataRow.SetValues(valuearray); //array of {Name:"myColumnName",Value:"myValue",Style:"css",Link:"url"} - where Name is a column names and Value is the value for this row.
Style is an optional parameter that overrides the default appearance of the data value. It is a limited set of CSS. The CSS commands supported are:
['background-color', 'color', 'font-style', 'font-weight', 'text-align', 'text-decoration', 'text-shadow']
Link is an optional parameter that applies a hyperlink to the value in the tool tip.
Usage
This method adds values for a row for the columns of a DataTable. Calling the method multiple times just appends the list of values. Specifying a column name that does not exists causes the value to be ignored.