Graphics are an invaluable tool that can make any report better—regardless of its size, scope or complexity.
Problem is, most of us aren't trained graphics designers. This may make the process seem a bit overwhelming.
Fortunately, SmartDraw takes the design and drawing problems out of the equation for you, letting you focus on the message you wish to convey.
Here are a few quick tips for creating SmartDraw graphics that will enhance any report and can actually save both you and your reader time and effort.
This is really up to you, but there are occasions when they are extremely helpful for both your reader/audience and also will save you a lot of time in report preparation.
Here are a few of those occasions:
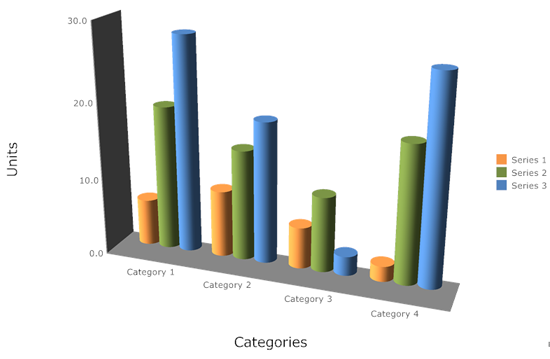
- You are presenting numerical data to show trends, distributions, or comparisons.
- You are giving instructions or explaining a process that requires too many words and could easily be misinterpreted or misunderstood.
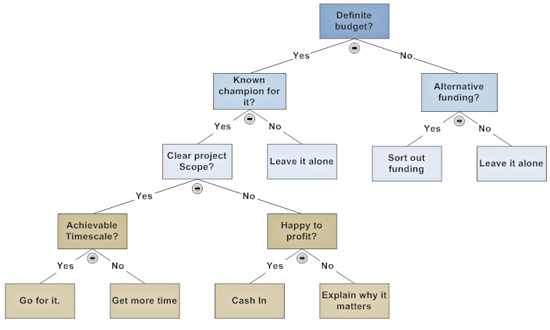
- You are presenting information for choices or decisions that need to be made.
- Data. Instead of showing a data table, show the data graphically. A line chart, bar chart, pie chart, or other diagram is a much more interesting and effective way to show numbers. Plus, it only requires a click to import your data table from your Excel® spreadsheet into SmartDraw, with a much more professional-looking result.
- Instructions. Trying to explain instructions orally or in writing can be difficult. Trying to follow someone else's instructions can often be confusing, too. A more practical method of presenting a process is with a flowchart.
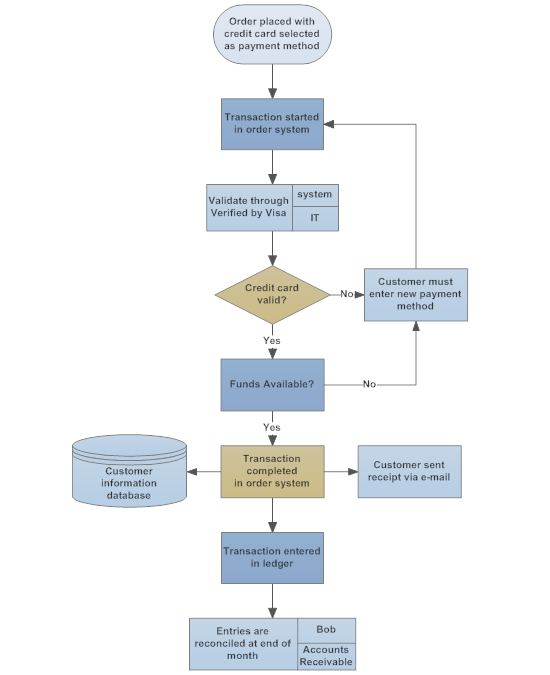 If you haven't tried creating a flowchart with SmartDraw, you'll be amazed at how fast and easy it is. It does all the spacing and adds connecting lines for you. When you add, delete or move an element, everything adjusts and realigns, saving you considerable time and effort.
- Choices or decisions. Depending upon the type of information you wish to present, a decision tree or a cause-and-effect diagram can be very useful. SmartDraw also offers the same smart formatting for these types of diagrams that you enjoy when making flowcharts.
 If the choice being discussed involves tangible items, consider adding photographs of them. It's easy to insert picture files (.jpg, .png. .bmp and other formats) into your SmartDraw diagram. Don't overlook the value of pictures to help further clarify process or decision diagrams.
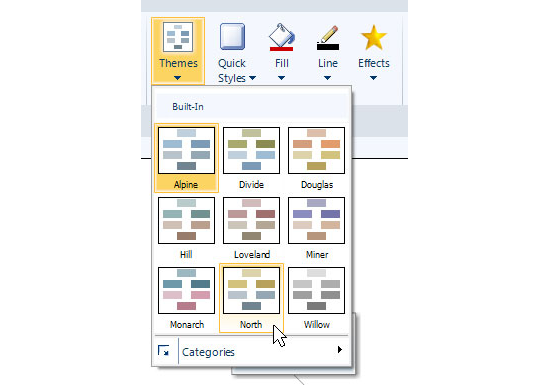
Generally speaking, it's best to not use too much time in creating report graphics. Get your point across, but don't use fancy colors, backgrounds, or formatting. They just waste your time unnecessarily and can confuse your reader or audience. SmartDraw gives you a number of choices of pre-designed themes that you can apply with just a click.
Remember, your goal is to provide clarity and save everyone (including you) time. Use SmartDraw and keep it simple to achieve this aim.