Sometimes a shape may represent an item that has lots of data. For example a position in an organizational chart may represent a person with lots data beyond his or her name and title:
- Date of Hire
- Phone extension
- Email
- Office location
You can add all this information to the org chart shape by inserting a table in each shape.
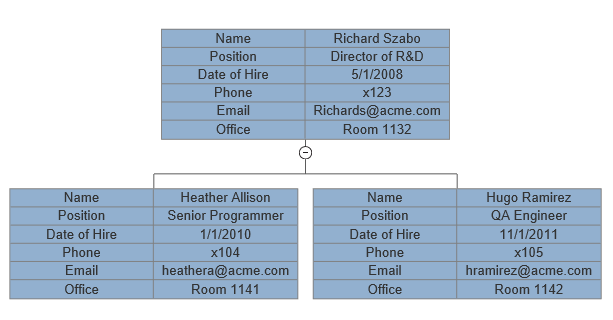
However, showing this information in each shape makes the chart larger and more difficult to follow. The script for this example is also very detailed:
{
                    var myDocument=new VS.Document();
                    var rootShape=myDocument.GetTheShape();
                    var myTable=rootShape.AddTable(6,2);
                    myTable.SetColumnWidth(175);  //set the columns wide enough for the text
                    //add labels
                    myTable.AddCell(1,1).SetLabel("Name");
                    myTable.AddCell(2,1).SetLabel("Position");
                    myTable.AddCell(3,1).SetLabel("Date of Hire");
                    myTable.AddCell(4,1).SetLabel("Phone");
                    myTable.AddCell(5,1).SetLabel("Email");
                    myTable.AddCell(6,1).SetLabel("Office");
                    //add values
                    myTable.AddCell(1,2).SetLabel("Richard Szabo");
                    myTable.AddCell(2,2).SetLabel("Director of R&D");
                    myTable.AddCell(3,2).SetLabel("5/1/2008");
                    myTable.AddCell(4,2).SetLabel("x123");
                    myTable.AddCell(5,2).SetLabel("Richards@acme.com");
                    myTable.AddCell(6,2).SetLabel("Room 1132");
                    var myConnector=rootShape.AddShapeConnector("Orgchart");
                    var myChild1=myConnector.AddShape();
                    myTable=myChild1.AddTable();   //this returns the table already there because it was inherited from the rootShape - note leave out the number of rows and columns
                    //add values
                    myTable.AddCell(1,2).SetLabel("Heather Allison");
                    myTable.AddCell(2,2).SetLabel("Senior Programmer");
                    myTable.AddCell(3,2).SetLabel("1/1/2010");
                    myTable.AddCell(4,2).SetLabel("x104");
                    myTable.AddCell(5,2).SetLabel("heathera@acme.com");
                    myTable.AddCell(6,2).SetLabel("Room 1141");
                    var myChild2=myConnector.AddShape();
                    myTable=myChild2.AddTable();   //this returns the table already there because it was inherited from the rootShape - note leave out the number of rows and columns
                    //add values
                    myTable.AddCell(1,2).SetLabel("Hugo Ramirez");
                    myTable.AddCell(2,2).SetLabel("QA Engineer");
                    myTable.AddCell(3,2).SetLabel("11/1/2011");
                    myTable.AddCell(4,2).SetLabel("x105");
                    myTable.AddCell(5,2).SetLabel("hramirez@acme.com");
                    myTable.AddCell(6,2).SetLabel("Room 1142");

                    var vsJSON = myDocument.toJSON(); //turn the VisualScript object constructed using the API into a JSON string
                    vsCompleteCallback(vsJSON); //pass the JSON string into the callback to trigger the creation of a document.
                    }
Compare this with the same example using shape data:
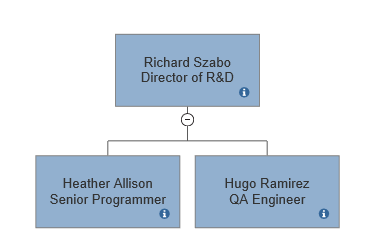
Hovering over the small "i" icon on each shape displays a tool tip that shows the additional data:
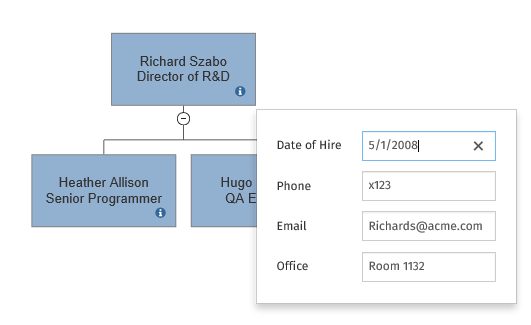
The result is a much cleaner looking diagram that still provides access to the full data record represented by the shape.
And code is simpler too:
{
                    var myDocument=new VS.Document();
                    var myDataTable=myDocument.AddDataTable(1,"HRInfo");
                    myDataTable.SetColumns([{Name:"Date of Hire",Type:VS.DataColumnTypes.Date},
                    {Name:"Phone",Type:VS.DataColumnTypes.Text},
                    {Name:"Email",Type:VS.DataColumnTypes.Text},
                    {Name:"Office",Type:VS.DataColumnTypes.Text}]);
                    var rootShape=myDocument.GetTheShape();
                    rootShape.SetLabel("Richard Szabo\nDirector of R&D");
                    var dataRow=rootShape.AddShapeDataRow(myDocument,1);
                    dataRow.SetValues([{Name:"Date of Hire",Value:"2008-5-1"},
                    {Name:"Phone",Value:"x123"},
                    {Name:"Email",Value:"RichardS@acme.com"},
                    {Name:"Office",Value:"Room 1132"}]);
                    var myConnector=rootShape.AddShapeConnector("Orgchart");
                    var myChild1=myConnector.AddShape();
                    myChild1.SetLabel("Heather Allison\nSenior Programmer");
                    dataRow=myChild1.AddShapeDataRow(myDocument,1);
                    dataRow.SetValues([{Name:"Date of Hire",Value:"2010-1-1"},
                    {Name:"Phone",Value:"x104"},
                    {Name:"Email",Value:"heathera@acme.com"},
                    {Name:"Office",Value:"Room 1141"}]);
                    var myChild2=myConnector.AddShape();
                    myChild2.SetLabel("Hugo Ramirez\nQA Engineer");
                    dataRow=myChild2.AddShapeDataRow(myDocument,1);
                    dataRow.SetValues([{Name:"Date of Hire",Value:"2011-11-1"},
                    {Name:"Phone",Value:"x105"},
                    {Name:"Email",Value:"hramirez@acme.com"},
                    {Name:"Office",Value:"Room 1142"}]);

                    var vsJSON = myDocument.toJSON(); //turn the VisualScript object constructed using the API into a JSON string
                    vsCompleteCallback(vsJSON); //pass the JSON string into the callback to trigger the creation of a document.
                    }
There are two steps required to incorporate shape data into VisualScript:
- Defining a data table
- Adding rows of data and assigning them to a shape
Shape data is modeled on the rows and columns of a database (or spreadsheet). The columns specify the fields of the database (the "schema"). The rows represent data records or sets of values for the fields. A shape may be mapped to a one row in a data table.
The data table is added to a Document using the AddDataTable(ID,Name) method of VisualScript object.
{
                    var myDocument=new VS.Document();
                    var myDataTable=myDocument.AddDataTable(1,"HRData");

                    var vsJSON = myDocument.toJSON(); //turn the VisualScript object constructed using the API into a JSON string
                    vsCompleteCallback(vsJSON); //pass the JSON string into the callback to trigger the creation of a document.
                    }
The ID is a unique identifier you can use later to refer to the table and the Name is a human readable name that labels the table in the SmartDraw UI for Extensions.
You add columns to the DataTable using its SetColumns method:
{
                    var myDocument=new VS.Document();
                    var myDataTable=myDocument.AddDataTable(1,"HRInfo");
                    myDataTable.SetColumns([{Name:"Date of Hire",Type:VS.DataColumnTypes.Date},
                    {Name:"Phone",Type:VS.DataColumnTypes.Text},
                    {Name:"Email",Type:VS.DataColumnTypes.Text},
                    {Name:"Office",Type:VS.DataColumnTypes.Text}]);

                    var vsJSON = myDocument.toJSON(); //turn the VisualScript object constructed using the API into a JSON string
                    vsCompleteCallback(vsJSON); //pass the JSON string into the callback to trigger the creation of a document.
                    }
You pass an array of Column names and types to define the columns. A second call to AddDataTable() with unique column names adds new columns to the data table.
You can define shape data in-line by:
- Adding a DataRow to the Shape object and
- Setting the values of the DataRow
{
                    var dataRow=rootShape.AddShapeDataRow(myDocument,1);
                    dataRow.SetValues([{Name:"Date of Hire",Value:"2008-05-01"},
                    {Name:"Phone",Value:"x123"},
                    {Name:"Email",Value:"RichardS@acme.com"},
                    {Name:"Office",Value:"Room 1132"}]);

                    var vsJSON = myDocument.toJSON(); //turn the VisualScript object constructed using the API into a JSON string
                    vsCompleteCallback(vsJSON); //pass the JSON string into the callback to trigger the creation of a document.
                    }
The SetValues method takes an array of field name/value pairs.
The DataTable object may have a Rows array that defines rows of data. Shapes can be mapped to these rows using the "RowID" for each row.
{
                    var myDocument=new VS.Document();
                    var myDataTable=myDocument.AddDataTable(1,"HRInfo");
                    myDataTable.SetColumns([{Name:"Date of Hire",Type:VS.DataColumnTypes.Date},
                    {Name:"Phone",Type:VS.DataColumnTypes.Text},
                    {Name:"Email",Type:VS.DataColumnTypes.Text},
                    {Name:"Office",Type:VS.DataColumnTypes.Text}]);
                    var row1=myDataTable.AddDataRow(1);
                    row1.SetValues([{Name:"Date of Hire",Value:"2008-5-1"},
                    {Name:"Phone",Value:"x123"},
                    {Name:"Email",Value:"RichardS@acme.com"},
                    {Name:"Office",Value:"Room 1132"}]);
                    var row2=myDataTable.AddDataRow(2);
                    row2.SetValues([{Name:"Date of Hire",Value:"2010-1-1"},
                    {Name:"Phone",Value:"x104"},
                    {Name:"Email",Value:"heathera@acme.com"},
                    {Name:"Office",Value:"Room 1141"}]);
                    var row3=myDataTable.AddDataRow(3);
                    row3.SetValues([{Name:"Date of Hire",Value:"2011-11-1"},
                    {Name:"Phone",Value:"x105"},
                    {Name:"Email",Value:"hramirez@acme.com"},
                    {Name:"Office",Value:"Room 1142"}]);
                    var rootShape=myDocument.GetTheShape();
                    rootShape.SetLabel("Richard Szabo\nDirector of R&D");
                    //associate row 1 with this shape
                    rootShape.SetShapeDataRow(1,1);
                    var myConnector=rootShape.AddShapeConnector("Orgchart");
                    var myChild1=myConnector.AddShape();
                    myChild1.SetLabel("Heather Allison\nSenior Programmer");
                    //associate row 2 with this shape
                    myChild1.SetShapeDataRow(1,2);
                    var myChild2=myConnector.AddShape();
                    myChild2.SetLabel("Hugo Ramirez\nQA Engineer");
                    //associate row 3 with this shape
                    myChild2.SetShapeDataRow(1,3);

                    var vsJSON = myDocument.toJSON(); //turn the VisualScript object constructed using the API into a JSON string
                    vsCompleteCallback(vsJSON); //pass the JSON string into the callback to trigger the creation of a document.
                    }
The inline definition of data rows with each shape is easier to use if you discover the shape data as you add each shape to the diagram.
Including the data rows in the DataTable is easier if you know the full table of data before you start adding shapes.