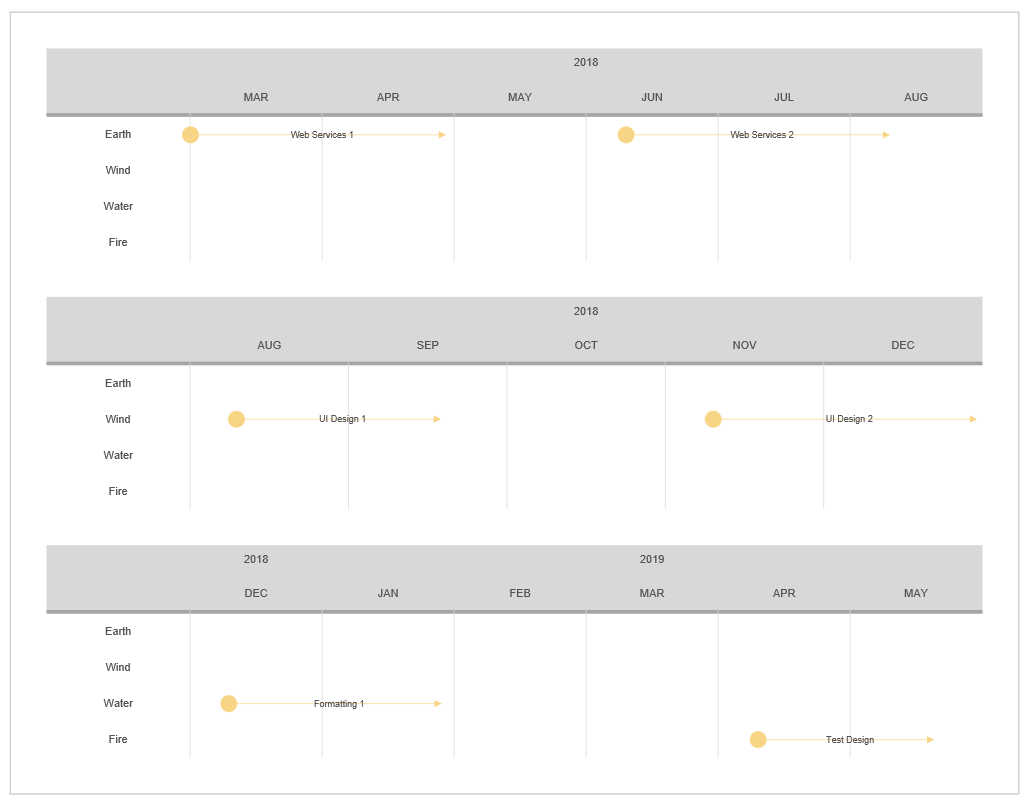
You can add a Timeline to any shape. A Timeline is a specialized object that shows a period of time as a special kind of table and then positions an array of events on it.
A shape that contains a Timeline cannot also contain a Table.
There are two types of timelines: Row and Grid.
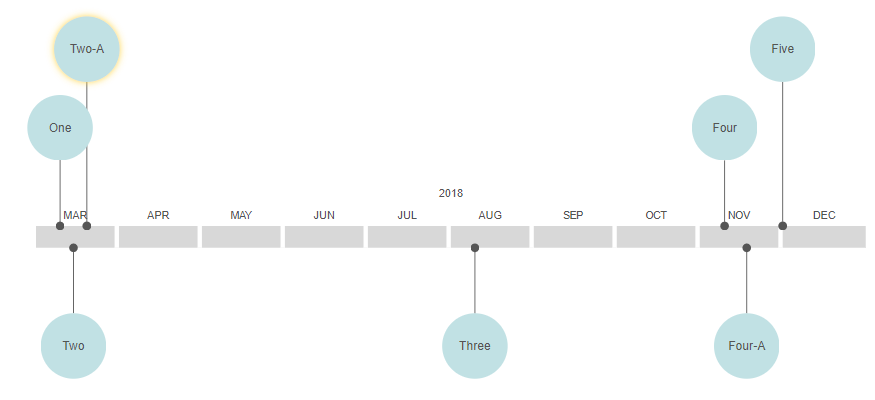
Row timelines show a date range with "bubble" type event shapes attached to it for each event, like this:
Grid timelines show a date range with additional rows below it. The event shapes are horizontal and lie on the rows, like this:

Grid timeline events can show the duration of an event based on their length. Bubble events show only the "start" of the event.
You create a Row timeline by adding a Timeline to a shape with the Row1 arrangement:
{
  "Shape": {
    "ID": 1,
    "Hide": true,
    "Timeline": {
      "Arrangement": "Row1"
    }
  }
}
Row1 is also the default if no Arrangement is set.
In addition to setting the layout of the timeline, Row1 also sets up a default color scheme and design for the events.
Adding a Timeline to a shape resizes it to 12 inches wide and tall enough to accommodate the timeline.
Once the timeline is added to a shape, the next step is to add the events to the timeline using the Events array:
{
  "Timeline": {
    "Events": [
      { "ID": 2, "Label": "Kickoff",     "Start": "2020-01-15" },
      { "ID": 3, "Label": "Beta",        "Start": "2020-04-01" },
      { "ID": 4, "Label": "GA",          "Start": "2020-06-15" },
      { "ID": 5, "Label": "Retro",       "Start": "2020-09-01" }
    ]
  }
}
Start is the date that the event happened (or began). It has a "YYYY-MM-DD" format. If Start is moitted, today becomes the default date for the event.
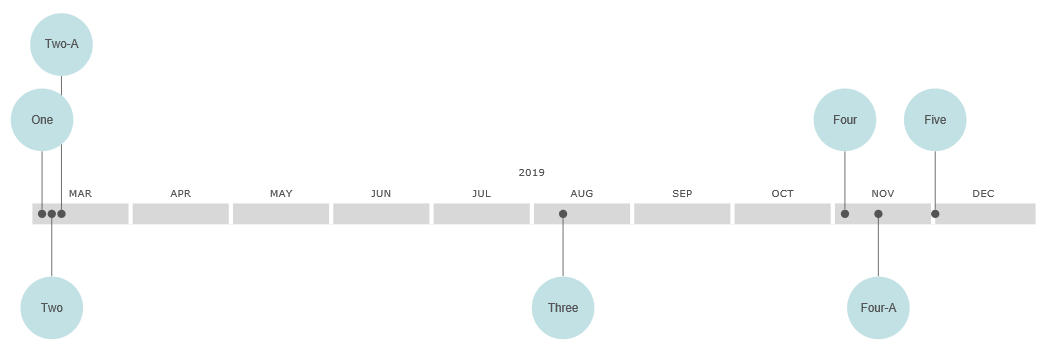
Note that the events are set to alternate above and below the timeline by default. Also notice other defaults:
- The events are bubble type
- They have a circular shape as the bubble
- They touch the timeline along its center line
You can override any of these defaults.
The EventType property of a timeline (or of an individual event) lets you choose the event style.
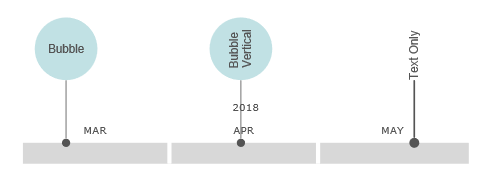
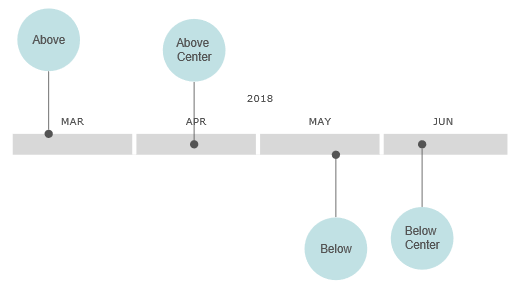
The Position property of a timeline (or of an individual event) sets where the line part of the bubble event touches the timeline. Above and Below place the events so they connect at the top or bottom edge of the timeline. AboveCenter and BelowCenter both connect to the center position of the timeline.
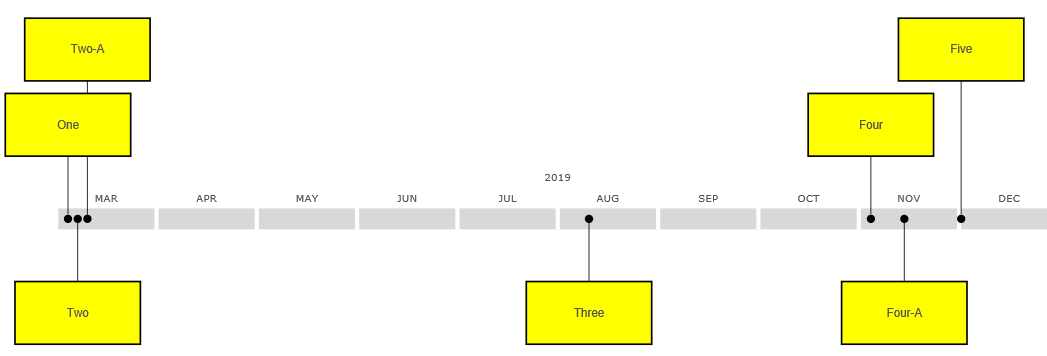
Timeline has a DefaultShape. It determines the settings for the shape at the end of the bubble event.
This DefaultShape changes the events to use as a rectangle as the bubble shape, sets its fill color to yellow, and sets its border to a 2/100" black line.
{
  "Timeline": {
    "DefaultShape": {
      "ShapeType": "Rect",
      "FillColor": "#FFFF00",
      "LineColor": "#000000",
      "LineThick": 2
    },
    "Events": [ ... ]
  }
}
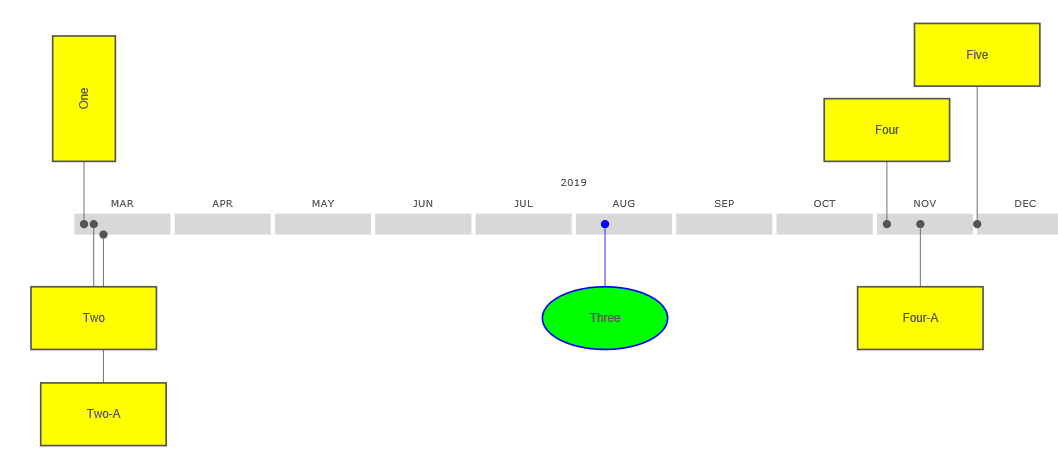
You can override the DefaultShape and other timeline settings for individual events:
{
  "Events": [
    { "ID": 2, "Label": "Highlight", "Start": "2020-01-15", "FillColor": "#FF0000" }
  ]
}
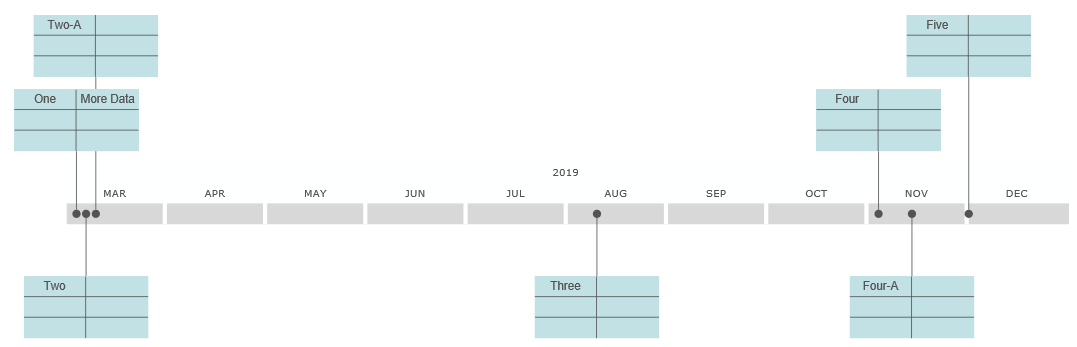
You can even add a Table to the shape on the end of the bubble and show multiple values and hyperlinks.
Like everything else in VSON, timelines use intelligent formatting. You don't need to set the date range of the timeline, specify the exact placing for events, or worry about preventing events from overlapping. The intelligent formatting engine takes care of this.
The scale of the timeline is calculated based on the date range of events and the length of the shape that contains the timeline. The engine tries to show the smallest division of time it can that still fits all of the events. The columns are labeled automatically. If we take the timeline above and shrink it to about 4 inches the scale changes to quarters:
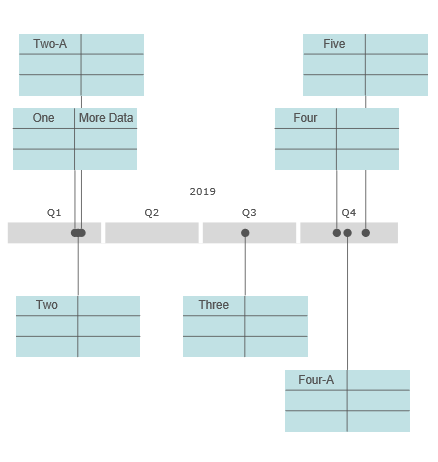
The engine places events on the timeline exactly where they are supposed to be and adjusts the length of the lines connecting the bubble shape to a timeline to avoid overlapping shapes that are close together.
You can turn off the automatic selection of a range and scale using the Auto property.
{
  "Timeline": {
    "Auto": false,
    "Start": "2020-01-01",
    "Length": 200
  }
}
If you do this, you can use additional Timeline properties to set the starting date, length, and units (days, months, years, etc.) of the timeline.
If the starting date and length conflict with the units, the units are adjusted. For example, if the starting and ending dates differ by one year and the units are set to days, unless the Timeline shape is wide enough to accommodate 365 columns, the units will be adjusted to the smallest division that will fit.
The following properties are used to set the starting date for a timeline with no events, or one with Auto set to false:
- Start - the starting date for the Timeline
- Length - the length in days between the starting dates and ending dates
- The units of the timeline are derived from these and the available width
Events that occur on dates outside the range of a fixed scale Timeline do not appear.
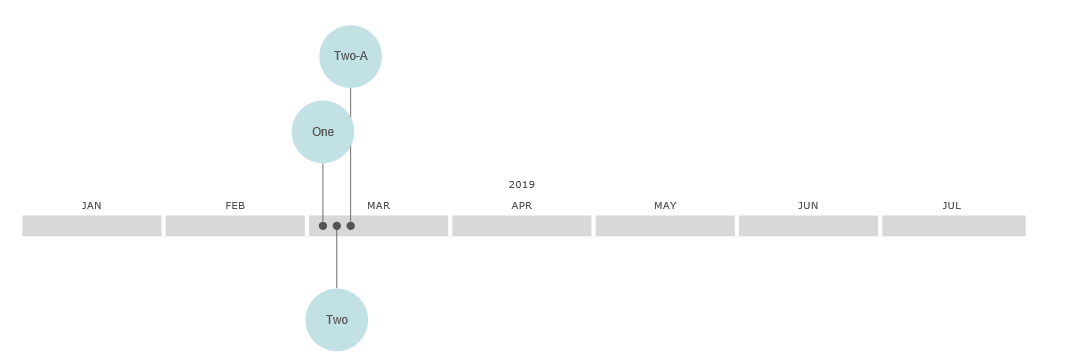
Setting a fixed scale is most useful when you know the expected range of your events and want a specific scale that will fit.
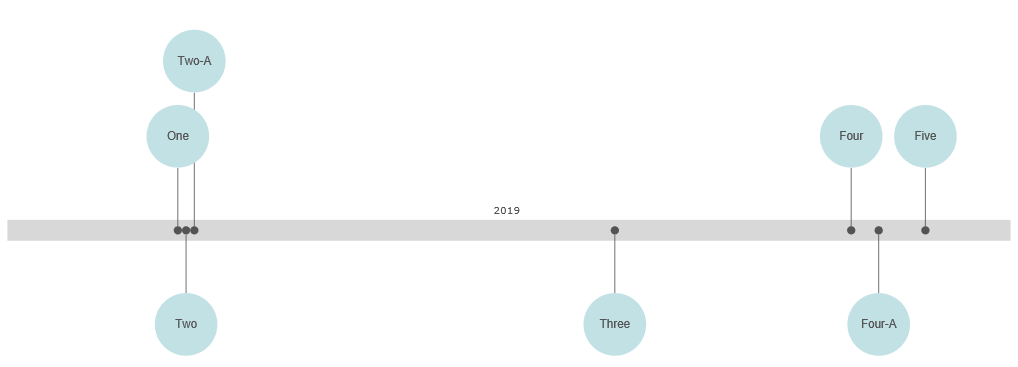
The width of a shape that contains a timeline is 12 inches by default. You can override this by setting the MinWidth of the shape containing the timeline.
{
  "Shape": {
    "ID": 1,
    "MinWidth": 1800,
    "Timeline": { ... }
  }
}
The minimum width for a timeline is 4 inches.
The height of a timeline is determined by its row height, which is determined by the font and size of the text used to show the labels. This is Arial 11 point by default. You can override these defaults using the text properties on the parent shape of the timeline.
By default, an event starts at 00:00 on its start date. You can set a specific time using the StartTime property for an event. The value is a string in "HH-MM-SS" format.
{
  "Events": [
    { "ID": 2, "Label": "Kickoff", "Start": "2020-01-15", "Starttime": "09-00-00" }
  ]
}
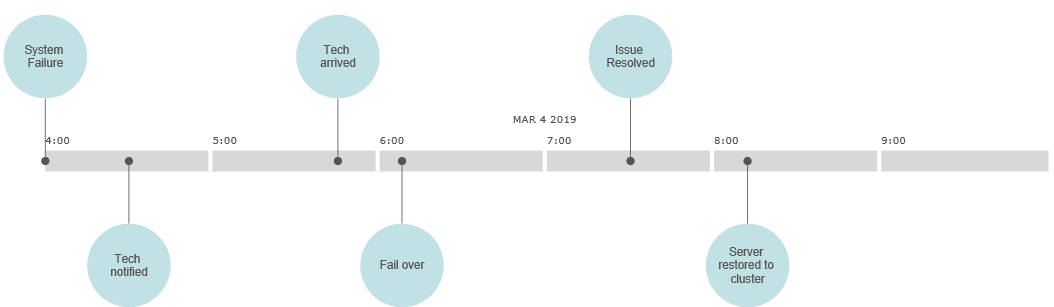
You create a Grid timeline by setting Arrangement to "Grid1" on the Timeline.
{
  "Timeline": {
    "Arrangement": "Grid1"
  }
}
By default Grid timelines use bars for events. They can also use bullets. The events lie on one of the grid's rows.
You can add multiple rows to a Grid timeline using the Rows array. Each row entry takes a Label shown in the left column of the grid.
{
  "Timeline": {
    "Arrangement": "Grid1",
    "Rows": [
      { "Label": "Engineering" },
      { "Label": "Design" },
      { "Label": "Marketing" }
    ]
  }
}

Adding events creates bars where the length indicates the duration of the event.
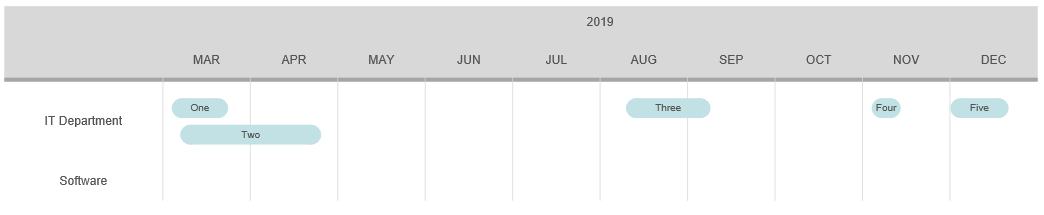
Note that the events placed in the first row by default and that intelligent formatting keeps the bars from overlapping by growing the height of a row and placing the two bars at different vertical positions.
We can assign the events to specific rows using the Position property of each event with the row number as the value:
{
  "Events": [
    { "ID": 2, "Label": "Sprint 1",  "Start": "2020-01-15", "Duration": 14, "Position": "1" },
    { "ID": 3, "Label": "Brand",     "Start": "2020-02-01", "Duration": 21, "Position": "2" },
    { "ID": 4, "Label": "Launch",    "Start": "2020-03-15", "Duration": 7,  "Position": "3" }
  ]
}

You can replace the bar events with bullets by setting the EventType of the timeline to bullets:
{
  "Timeline": {
    "Arrangement": "Grid1",
    "EventType": "Bullet"
  }
}

You can set the type at the timeline level as the default, like above, or set the EventType of individual events to override the default.
Like bubble events you can change the appearance of the bullets or bars by using the DefaultShape of the timeline, or by setting properties like colors and thickness on the event object itself.
Grid timelines can also show hours and minutes just like Row timelines.
The Block Timeline is a variant of a Grid Timeline that uses Block Events by default. You can create a Block Timeline by setting Arrangement to "GridBlock1" on the timeline.
{
  "Timeline": {
    "Arrangement": "GridBlock1"
  }
}
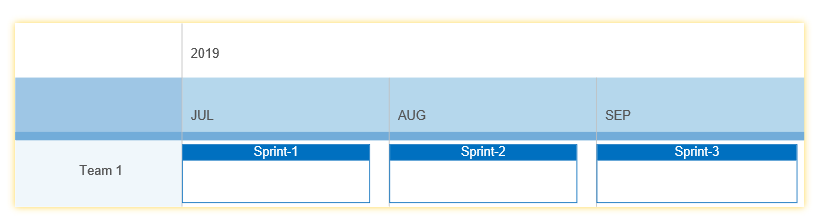
The events on a Block Timeline have a table format by default. You can set the label of the event (such as the Sprint name) and then add a label that names the issue in the second row.
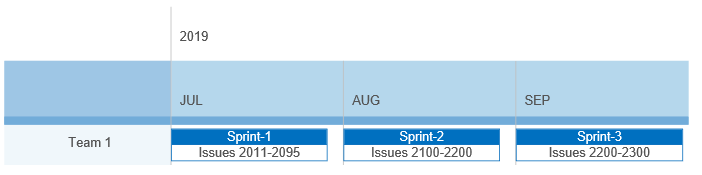
The Swimlane Timeline is a variant of a Grid Timeline that uses Swimlane Events by default. You can create a Swimlane Timeline by setting Arrangement to "GridSwimlane1" on the timeline.
SWimlane events are meant to serve as a backdrop for other (usually block) events. They are placed behind a transparent timeline and do not try to avoid overlapping each others events. They are an ideal way to represent the program increments in a product roadmap. Swimlane events also automatically extend to the bottom of the timeline.
Adding a block event to a swimlane timeline ignores the DefaultShape that controls the design of the swimlanes and uses the default design of events for the Block Timeline. You can override this by defining your own table. You can remove the table by adding a table with 0 rows.
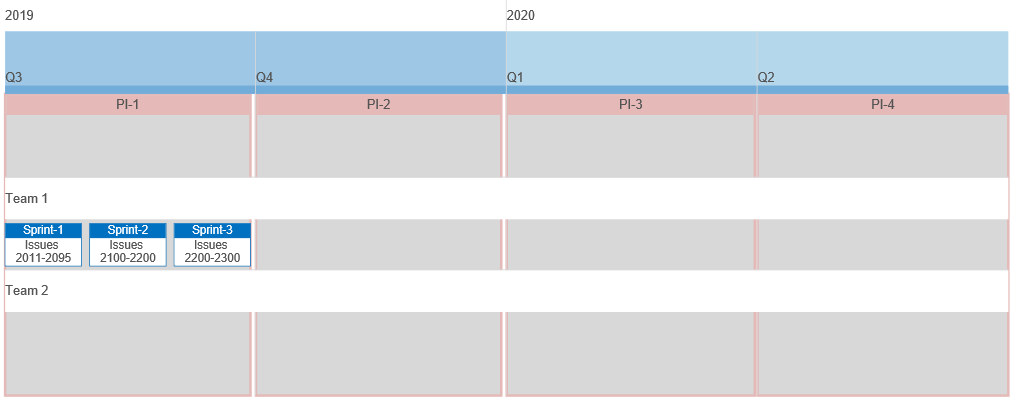
In the Swimlane Timeline example above instead of a title column at the left, the event rows have titles above them. This is achieved using two features of the timeline:
- HideGridLabelColumn: true - This hides the row label column.
- Adding a row of type LabelRow tot eh Rows array - This adds a row with a label that spans the while timeline.
You can create a stack of timelines on the same page using a ShapeContainer:
{
  "Shape": {
    "ID": 1,
    "Hide": true,
    "ShapeContainer": {
      "Arrangement": "Column",
      "Shapes": [
        { "ID": 2, "Timeline": { "Arrangement": "Row1", "Events": [ ... ] } },
        { "ID": 3, "Timeline": { "Arrangement": "Row1", "Events": [ ... ] } },
        { "ID": 4, "Timeline": { "Arrangement": "Row1", "Events": [ ... ] } }
      ]
    }
  }
}
We now get the same three shapes as timelines. This also allows you to "wrap" a long timeline into multiple rows for easier display on a page or report.