The VisualScript Cookbook

6/20 Page

Adding Text to Shapes in VisualScript

By default shapes contain no text. Using SetLabel() for a shape object will cause a text label to appear in the shape using the default font, text color, and alignment.

{
            myShape.SetLabel("This is a text label");
            }
          
VisualScript shape with text

Just as the default values for properties like the FillColor of a shape can be overridden by explicitly defining values for them as part of the object record, so defaults for text properties can be overridden.

Aligning Text in the Shape

The horizontal alignment is specified with the "TextAlignH" property (left, right, center) and the vertical alignment is specified with the "TextAlignV" propriety (top,bottom, middle).

{
            myShape.SetLabel("This is a text label").SetTextAlignH(VS.TextAlignH.Left).SetTextAlignV(VS.TextAlignH.Top);
            }
          
Left align text

Changing the Appearance of the Text

You can override the default text options using a few mehtods in the VisualScript SDK. For example, the SetTextFont() sets the name of the font, SetTextSize() sets the size of the text in points, SetTextBold(), SetTextItalic() and SetTextUnderline() take boolean values that turn on or off bold, italic and underline. SetTextColor() sets the color. These commands all apply to the entire label.

{
              myShape.SetLabel("Text is Blue").SetTextColor("#0000FF").SetTextItalic(true).SetTextSize(14);
              }
            
Blue text

Controlling the Amount of Text Shown in a Shape or Table Cell with SetTextTruncate()

When the label assigned to a shape or a table cell is derived from data and may be longer than can what can comfortably fit inside the shape, you can truncate it. You do this using the SetTextTruncate() method and by setting the number of characters exceeds a maximum.

{
                myShape.SetTextTruncate(20);
                }
              
Truncated text

Showing Multiple Data Values in a Single Shape

When building a diagram from data, a shape often represents a data record and often data records have multiple fields, each with a different value.

The simplest approach is just to show one value that identifies the record in the shape. For example in a flowchart of a workflow show the name of the step in the shape as a "Label". But what if you want to show two or more field values in a shape? One way to do this is using a table:

Using a Table to Show Multiple Values

Any shape can be subdivided into a table of cells by dividing it into rows and columns using the shape's AddTable() method. This takes the number of rows and columns as required arguments.

{
           var myTable=myShape.AddTable(NRows,NColumns);
           }
         

{
             var myTable=myShape.AddTable(3,2);
             }
           
A two column table

Each of the six cells in this table can have its own "Label", colors etc, just like a shape.

{
            var myTable=myShape.AddTable(3,1);
            var myCell1=myTable.AddCell(1,1);
            myCell1.SetLabel("Value1");
            var myCell2=myTable.AddCell(2,1);
            myCell2.SetLabel("Value2");
            }
          
Add text to tables

Tables are very flexible and making them look the way you want is explained in the Table section of this cookbook.

Using Concatenation to Show Multiple Values

A second way to show multiple values in a shape is to concatenate the values on separate lines. The \n in a text string creates a new line.

{
            myShape.SetLabel("Value1\nValue2");
            }
          
Text in multiple lines

Using Shape Data to Show Multiple Values

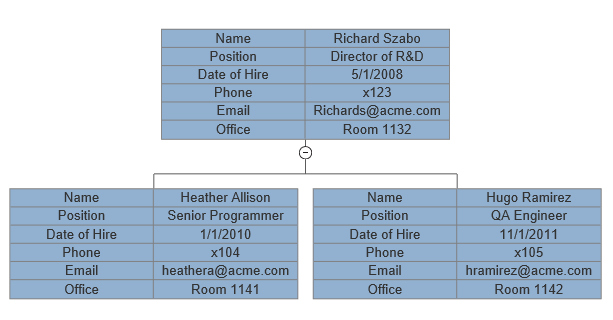
If a shape represents a record with many values it becomes less practical to show them all in the shape itself, even using tables. A third alternative is to show some of the values in a tool tip using Shape Data.

Compare this complicated org chart:

VisualScript shapes with rows

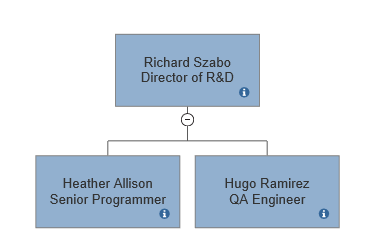
with the same example using shape data:

VisualScript shape data

Hovering over the small "i" icon on each shape displays a tool tip that shows the additional data without cluttering up the visual:

VisualScript shape data hover

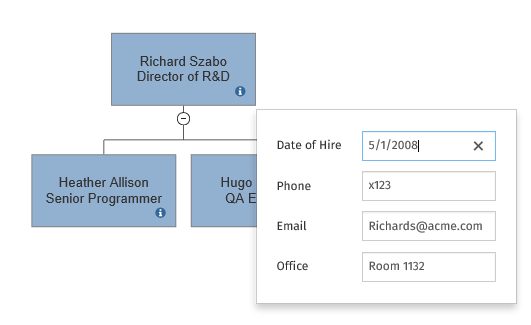
Read more about Shape Data with VisualScript.

Adding a Title

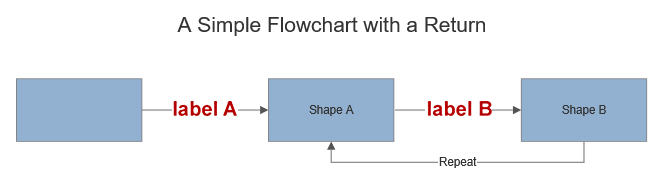
Adding a title to your diagram is accomplished by adding a "Title" object to your VisualScript object.

{
        var myTitle=myDocument.AddTitle("This is a title");
        myTitle.SetTextSize(18);
        }
      

The Title object contains a Label and can be styled with the standard text properties. Entering /n in the label text causes a line break.

The title is centered above the diagram.

{
        var myDocument= new VS.Document();
        var myTitle=myDocument.AddTitle("A Simple Flowchart with a Return");
        myTitle.SetTextSize(18);
        var rootShape=myDocument.GetTheShape();
        var myConnector=rootShape.AddShapeConnector("Flowchart");
        myConnector.SetEndArrow(VS.Arrowheads.Filled).SetTextSize(18).SetTextColor("#FF0000");
        var myShape1=myShapeConnector.AddShape();
        myShape1.SetLabel("Shape A").SetLineLabel("label A").SetID(1);
        var myShape2=myShapeConnector.AddShape();
        myShape2.SetLabel("Shape B").SetLineLabel("label B").SetID(21);
        var myReturn=myDocument.AddReturn(1,21);
        myReturn.SetLabel("Repeat");
        }
      

VisualScript shape data hover
6/20 Page
By continuing to use the website, you consent to the use of cookies.   Read More