This guide will walk you through everything you will want to know about VisualScript, its building blocks,
and how to generate diagrams automatically from data that show hierarchy and relationships such as flowcharts, org charts, timelines, gauges, and more.
To transform your data into a visual, you'll use the VisualScript SDK.
The SDK is available in JavaScript, Java and C#. This makes it easy to visualize data as
flows, trees, timelines, and other designated formats without using coordinates.
This simple JavaScript is rendered as an org chart:
var vs = new VS.Document(); //Create a new VisualScript document
                    var theShape= vs.GetTheShape();
                    var myConnector=theShape.AddShapeConnector(VS.ShapeConnectorTypes.OrgChart);  //add the org chart connector to the top shape
                    myConnector.AddShape(); //add the first shape to the connector
                    myConnector.AddShape(); //add the second shape to the connector
                    var vsJSON = vs.toJSON();   //Turn the VisualScript object constructed using the API into a JSON string
                    vsCompleteCallback(vsJSON); //Pass the JSON string into the callback to trigger the creation of a document
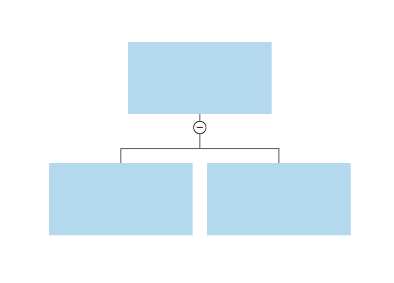
Just a few lines of code create a perfectly formatted hierarchy of three shapes.
What makes VisualScript so easy is that you can take advantage of powerful intelligent formatting.
To create a diagram using VisualScript, you don't have to use a coordinate system to describe the explicit placement of shapes,
instead you can leverage an intelligent rule-based formatting engine to simplify the format and reduce the work.
VisualScript makes it easy to create a third-party tool or template that can quickly turn data into diagrams, automatically.
The following analogy is helpful in understanding the innovation that VisualScript represents.
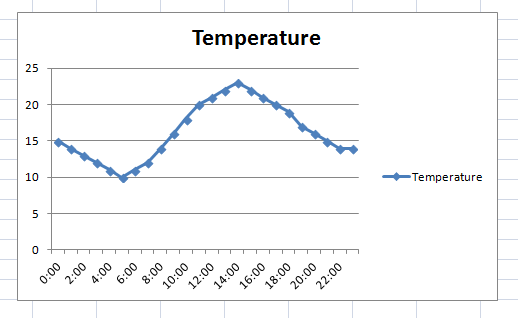
We are all used to software that can take a set of XY data and plot a graph.
Let's take for example a line graph made in Excel. To make the graph, you simply select two columns of data and request that Excel render a line graph. You don't specify the coordinates of each point on the line. You don't individually calculate the line between each point, or draw the axes separately, or define the pixels for numbers and text labels, and so forth. It would be no small feat to draw just a simple line graph if you had to calculate everything individually. Yet, about fifty years ago, that's exactly what you would have had to do to generate a graph on a computer using code. Today, we are completely used to the idea that to draw a graph, all we need to do is specify the type of graph we want and the data to plot and the software will draw it automatically.
But this has never been the case for diagrams until VisualScript.
In the very first VisualScript example we shared above, we specified that we wanted three shapes arranged in a hierarchy.
The intelligent formatting engine did the rest.
Now lets look at the equivalent of the "graph types" that VisualScript offers for automatically generating diagrams.